Introduction to the Illinois County School Facilities Sales Tax. Learn about this innovative funding source for schools and what it means to counties and school districts across the state. Produced by UNICOM-ARC, compliments of Stifel Nicolaus.
Introduction to the Illinois County School Facilities Sales Tax. Learn about this innovative funding source for schools and what it means to counties and school districts across the state. Produced by UNICOM-ARC, compliments of Stifel Nicolaus.
Fickes, 2014
When evaluating responses to bid requests, facility managers often select the lowest qualified bid. It makes perfect sense. Why would anyone pay more — in taxpayer dollars — than necessary?
In fact, some school facility managers are discovering the utterly anti-intuitive concept that paying more to build a school can reduce its overall total cost of ownership (TCO).
Palmese, 2014
There are approximately 133,000 schools in the U.S., with 10,221 of them, serving more than 6.2 million students, in California. Seventy-one percent of classrooms in the state are more than 25 years old and in need of repair or upgrading. As the economy forces school districts to slow their new building plans, they are focusing, at least for the time being, on their existing facilities, doing what they can to implement energy and water efficiency projects, installing renewable energy sources and greening their everyday operations.
It’s no longer debatable that even modest sustainability upgrades save money, and that savings can go into a district’s general fund. The “Catch 22” at present is that finding the funding to pay for saving money can be difficult. Creative financing options are needed, and Green Technology is working on a special project to document innovative financing options for green building, energy efficiency, renewable energy, water efficiency and the myriad of other sustainable aspects of building and running schools and community colleges.
National Charter School Resource Center, 2013
The Qualified School Construction Bond (QSCB) program, a federally subsidized borrowing program initiated as part of the 2009 American Recovery and Reinvestment Act, continues to be a source of support for charter school facilities development. A total of $22 billion in QSCBs were authorized nationwide, and some remain unused. For example, New Jersey announced in March 2013 an allocation of $125 million dedicated specifically for charter schools. In 2010, New Jersey made a $30 million allocation for charter schools, all of which was used, according to the New Jersey Economic Development Agency. This feature of the National Charter School Resource Center's monthly newsletter focuses on the QSCB program and provides information about the New Jersey effort, an explanation of how such debt arrangements work, and resources to further pursue the topic.
Springfield, 2012
In addition to private donations, research grants and student fees, bonds make up a large portion of funding for construction projects at the University of California, California State University and community college campuses. A variety of bonds are being used to pay for these projects, representing money that must be repaid in equally diverse ways.
In “Public universities plow ahead with construction despite tight budgets,” reporter Jon Marcus writes about bond-funded construction sprouting up on campuses across the state and the general confusion surrounding bond money.
Combs, Texas Comptroller of Public Accounts
Since 2010, the Comptroller’s Financial Allocation Study for Texas (FAST) has produced ratings of one
to five stars for Texas school districts and campuses. Created in response to 2009 legislation, we base these ratings on operational expenditures (the input) and academic progress (the output).
For its spending component, FAST uses operational expenditures — funded in large part by a district’s maintenance and operations (M&O) tax — which is spending directly related to teaching students.
Many school districts also levy an interest and sinking (I&S) tax to pay off debt issued for capital purchases (primarily school facilities). This construction survey is an effort to provide Texas school districts
and their taxpayers an opportunity to compare side-by-side new school construction costs over a multi-year sample.
Scott, 2012
State and local construction spending for education slipped by more than 25 percent from January 2009 to June 2012, its annual rate dropping more than $22 billion, according to a Governing analysis of data from the U.S. Department of Commerce, one of the steepest declines in state and local investment among individual sectors.
Primary and secondary education has taken the biggest hit: state and local construction spending has dropped from an annual rate of $58.6 billion in January 2009 to $37 billion in June 2012, a 37 percent decrease. Higher education construction spending has been more stable, dipping slightly from an annual rate of $23.9 billion in January 2009 to $23 billion in June 2012.
By Linda Lemasters.
In America we have accepted that public education is critical to the very foundation of our country. One of the topics that is not always considered when we discuss public education is equity. Are all schools provided with the same resources, quality of teaching, facilities, and parental support? We sometimes do not speak the obvious, but think about the schools you have visited in urban areas and how they differ from schools in the suburbs. The literature exposes the achievement gap in urban and suburban areas, but what about the funding gap? What differences are related to the funding in urban and rural areas?
Some of the funding differences may be due to the sprawl of the suburban areas, with suburban areas having higher transportation and utility costs. A study in Nova Scotia indicated the difference in the city’s annual costs per household between suburban and urban infrastructure and transportation in Halifax was $1,623 USD (Figure 1). What is most interesting about this visual, however, is the difference spent on schools, libraries, and school bussing. . .three items, which may relate directly or indirectly to the achievement gap. Some urban children have no free or public transportation to school and little or no access to libraries and the services they provide.
The consequences of funding disparities in American schools are sobering. “The funding gap shows that many low-income minority students are subjected to inferior facilities, less adequate teachers, and an incomparable curriculum to their counterparts” (Wright, 2012). Russo (2011) made the point more poignant when he wrote about Illinois schools, “In both 2002 and 2011, the 10 poorest schools on average spent 30 percent of what the 10 richest schools spent on average to educate each student. . .”
Let’s look more closely at the impact of the funding gap on school facilities. Local Education Agencies (LEAs) that do not receive adequate funding are putting students at a disadvantage with:
Often the poorer LEAs cannot focus on:
The Education Trust calculated the funding gap per student by poverty, minority background, and by state, based on data from the U.S. Census Bureau and the U.S. Department of Education, for the 2003-2004 school year. The numbers are staggering for many states. In the State of Pennsylvania, the gap between revenues per student in the highest- and lowest poverty districts is $1,001 and it is $454 per student in the highest-and lowest-minority districts. (Hobson, pp. 17-18)
Wiener and Pristoop (2006) took the per-student disparity and multiplied it by 25 students per classroom to illustrate how funding gaps can add up, classroom by classroom and school by school. Using this method, the projected funding difference in the State of New York between two elementary schools of 400 students—one from the highest-poverty quartile and one from the lowest-poverty quartile—would translate to $927,600 in favor of the richer district. In a similar way, the funding gap between two high schools of 1500 students in the State of Illinois would translate to a disparity of $2,886,000 in funding in favor of the district with less poverty.
Funding inequalities are present in federal, state, and local governments. Equalizing this funding is not likely to equalize the education all students receive; however, it is the first step to enhancing the education of our urban youth. This brings us full circle to what we discussed in the beginning of this blog: Funding does affect the achievement gap. Hobson stated it very well:
The benefits of equal funding, a prerequisite for improving quality education, outweighs [sic] the costs; this is especially true when the positive externalities of a value-added education are analyzed. Some of these positive externalities are: a diverse and skilled workforce, citizens who have a superior understanding of and participation in the democratic process, the loss of incentive to commit crimes as more education translates into a higher income capacity and greater conformity to a set of society values.
It seems only fitting that all students attend school in clean, healthy, safe environments; that they have quality teachers; that we rid our American public education system of the plague of disparities in educational quality and financing.
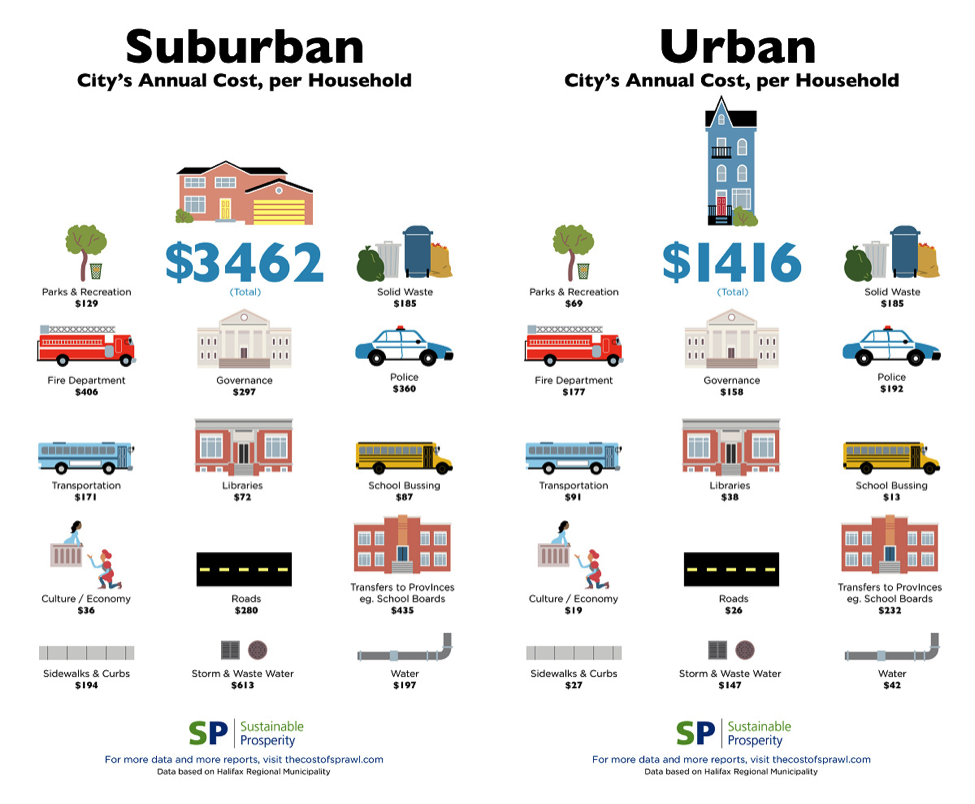
Figure 1: The Real Costs of Suburban Sprawl
References and resources:
Carrasco, A. (2015, March 9). The Real Costs of Suburban Sprawl in One Infographic. Downloaded on May 25, 2015: http://curbed.com/archives/2015/03/09/suburban-vs-urban-infrastructure-costs.php
Hobson, I. The Public Education Funding Dilemma. Downloaded on June 8, 2015: https://www.neumann.edu/academics/divisions/business/journal/Review2013/Hobson.pdf
Russo, A. (2011, November 8). Whatever Happened to School Funding Gaps? This Week in Education. Downloaded on June 6, 2015: http://scholasticadministrator.typepad.com/thisweekineducation/2011/11/the-much-ignored-school-funding-gap.html#.VXWh4mRViko
Wiener, R., & Pristoop. E. (2006). How states shortchange the districts that need the most help. Washington, DC: The Education Trust.
Wright, W. (2013). Proceedings of The National Conference on Undergraduate Research, 2012: The Disparities between Urban and Suburban American Education Systems: A Comparative Analysis Using Social Closure Theory. Ogden, Utah: Weber State University.
Linda Lemasters, Director, Education Facilities Clearinghouse
Linda is an associate professor in the Graduate School of Education and Human Development of The George Washington University, where she teaches graduate level coursework, advises students, and directs student research. Her areas of expertise and research include educational planning, facilities management, and women CEOs. She actively conducts research concerning the effects of the facility on the student and teacher, publishes within her field, and has written or edited numerous books including School Maintenance & Renovation: Administrator Policies, Practices, and Economics and book chapters including a recent chapter, Places Where Children Play, published July, 2014 in Marketing the Green School: Form, Function, and the Future.
Hobson
Relying heavily on income generated via local sources, mainly property taxes, to fund education has resulted in funding gaps, which have created disparities in the quality of education provided by public schools in the United States (U.S.). These funding gaps are further reinforced by the unequal allocation of education dollars at both the federal and state level.
Infographic via Sustainable Prosperity
Here's a great illustration of how the costs of urban and suburban infrastructure and transportation services vary greatly, with sprawling communities on the more expensive side of things. This handy infographic (click to expand) from environmental think tank Sustainable Prosperity, neatly displays the gaping differences between annual costs per household found in a study by the Halifax Regional Municipality in Nova Scotia. In total, the difference in annual city costs between suburban and urban homes in the region is $2,046 CAD, or $1,623 in U.S. dollars.

GW is committed to digital accessibility. If you experience a barrier that affects your ability to access content on this page, let us know via the Accessibility Feedback Form.