Skip to content

School Planning and Management

This article is on the President's FY 2016 budget proposal. It seems like an annual rite of spring. What is different? This year the release of the budget proposal is coupled with an energized Congressional effort to reauthorize the Elementary and Secondary Education Act [ESEA](aka No Child Left Behind) and the possibility of a few other education bills before the end of 2015. First the budget request will be described and followed by an update on the reauthorization of ESEA.

View Article

School Planning and Management, 2015

School Construction is once again a major player in the economy of the United States.  More than $14 billion worth of school construction - including new buildings and additions to, and upgrading of, existing buildings - was put in place in 2014, a five percent increase over the previous year and the fourth year in a row that spending for school construction has increased.

View article

Christina Samuels, 2015

Early-childhood providers will have access to a $100 million loan program to pay for classroom renovations and other infrastructure improvements, through a partnership announced Sunday at the Clinton Global Initiative's meeting in New York.

The loan funds will be used to renovate classrooms in seven cities and to build 250 new classrooms over the next three years, according to the announcement. Baltimore will be the launch point.

View Article

21st Century School Fund

An Educational Facilities Master Plan is a written document that describes the school district’s real estate and capital improvement requirements and its strategy and school specific plans for meeting these requirements over a 6-10 year period. On the real estate side, educational facility master plan elements will address the space needs for schools, administration and logistics, including proposed site selection, school closings and consolidations, attendance boundary changes, leasing, joint use and co-locations. On the capital improvement side, educational facility master plan elements will include: the justification, scope, schedule and estimated cost for major repairs, modernization and new construction.

Education Facilities Master Plan Evaluation Guide

By Dr. Linda Lemasters.

While writing the blog last week on the achievement gap, I read a great deal of research on urban education and inner city schools.  Education in rural America is mentioned often as an afterthought.  There is little knowledge of failing schools and children in need across sparsely populated farmlands, mountains, and deserts (Wang, 2014).  A few researchers are very vocal about problems of education reform in rural areas, and suggest more research is needed.  Until that happens there will be a limited awareness of facts and concerns about resources, programs, school buildings, and ultimately achievement in rural schools; and, education reform will be thwarted and limited.  The following are facts about rural education, which can jump-start our discussion:

  • One third of rural American schools have low-income students, low achievement on standardized tests, and low rates for college attendance (Rees, 2014).
  • Rural communities are generally small with a low local tax base, resulting in inadequate funding for schools.
  • Rural schools serve over 40% of U.S. students, yet receive only 22% of federal funding.
  • “. . . Students in rural communities are likelier than their peers to live in poverty and only 27% go on to college” (Rees, 2014).
  • Rural areas suffer a critical shortage of teachers, often employing teachers who are not licensed in the subjects they teach (Wang, 2014).
  • Based on USDoED statistics, reading and math scores in rural districts are as low or lower than those in urban districts (Biddle, 2011).
  • Graduation rates for poor and minority students who attended and/or graduated from rural high schools during the 2005-2006 school year were the same as the urban districts.Based on available research and anecdotal evidence, schools attended by low-income students have major deficiencies compared with those used by their richer peers.  Although there has not been a nation-wide survey for nearly 20 years, available state data suggest there is a nexus between the condition of schools, the number of low-income students attending schools, and their achievement.

In 2009, the Commonwealth of Pennsylvania conducted an enrollment and building capacity study (Yan).  Some of the findings of this work included:

  • Rural schools in general were older than their counterparts in the suburbs and cities, both in real and functional age.
  • Respondents from schools with functional ages of 15 years or more were more likely to note roofs, foundations, and walls as unsatisfactory, poor, or borderline.
  • Older schools typically had worse building safety conditions and often reported fire alarms, smoke detectors, and sprinkler systems in poor condition. Emergency lighting was rated as borderline.
  • Building energy efficiency was reported as poor or borderline in older facilities.
  • Building accessibility, handicapped accessibility, student drop-off areas, and vehicular ingress and egress were often rated poor or borderline in the older schools.

Arkansas, Virginia, Washington, DC., North Dakota, and other states also have been the topic of similar studies.  Dewees and Earthman’s (2000) research on rural schools noted that it was not unusual that rural students attend schools over 100 years old.  The Educational Facilities Clearinghouse has fielded calls from rural areas that report problems due to deferred maintenance and bond issues, which have been voted down numerous times.  The vote by the community may or may not be due to lack of support for the local schools; it may be a lack of income on the part of the voters or the low assessed value of local real estate.  In contrast, school age of urban schools is improving, and funds to build new urban schools are more available through local or state support or in some instances federal dollars.

Finally, I request you review the EdBuild student poverty map (Click here http://maps.edbuild.org/Dividing Lines.html#).  You can click on any of the pink to dark pink areas to see the population, student population, student poverty population, and student poverty rate.  Do you note that many rural areas have high rates of poverty?  Do you recognize that areas of poverty are in the midst of prosperous districts?

After analyzing the EdBuild map, take a look and compare the map of cities, towns, suburbs, and rural areas.  Pictorially note the rural areas (fringe, distant, and remote); many times they are in the heart of areas of poverty (NCES).

It would be negligent should I not mention that rural schools do produce students who achieve, many rural schools have small class sizes, and students are able to take advanced coursework by making use of distance learning and technology.  What I want to be recognized, however, is that rural schools often face the same challenges as our urban schools.  When it comes to research and funding, their needs must be recognized, if education reform is going to be successful in all of our united states.

Figure 1:  Student Poverty and School District Borders (Click here http://maps.edbuild.org/DividingLines.html# for interactive map)

Picture1


EdBuild (2015).


Picture2


Data Source : U.S. Census Bureau; Urban-centric Locale Codes, developed by the National Center for Education Statistics (NCES)

References and Resources

Linda Lemasters, Director, Education Facilities Clearinghouse

Linda is an associate professor in the Graduate School of Education and Human Development of the George Washington University, where she advises students, directs student research, and directs a project at Taibah University in the Kingdom of Saudi Arabia.  Her areas of expertise and research include educational planning, facilities management, and women CEOs.  She actively conducts research concerning the effects of the facility on the student and teacher, publishes within her field, and has written or edited numerous books including School Maintenance & Renovation:  Administrator Policies, Practices, and Economics and book chapters including a recent chapter, Places Where Children Play, published July, 2014 in Marketing the Green School:  Form, Function, and the Future.

By Dr. Linda Lemasters.

In 1973 Thurgood Marshall wrote the dissenting opinion in San Antonio Independent School District v. Rodriguez:

It is an inescapable fact that if one district has more funds available per pupil than another district, the former will have greater choice in educational planning than will the latter. In this regard, I believe the question of discrimination in educational quality must be deemed to be an objective one that looks to what the State provides its children, not to what the children are able to do with what they receive. That a child forced to attend an underfunded school with poorer physical facilities [emphasis added], less experienced teachers, larger classes, and a narrower range of courses than a school with substantially more funds—and thus with greater choice in educational planning—may nevertheless excel is to the credit of the child, not the State. Indeed, who can ever measure for such a child the opportunities lost and the talents wasted for want of a broader, more enriched education?

Though written 42 years ago, we continue to face many of the same disparities. I wrote about educational disparities a few months ago, but I would like to be more specific in my concerns. As a college professor in educational leadership, hardly a day goes by that an article, a conference announcement, an email, or a piece of research comes across my desk about the achievement gap. The gap is a real detriment to our country with a waste of talent, and immeasurable in its affect on our society.

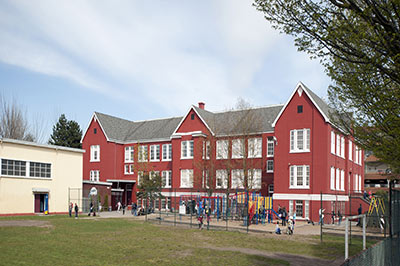
In the same articles, email, or research, varied solutions are proposed. Nearly all of them go back to the genesis of teaching, leadership, technology, supplies, class size, and/or many other suggestions, and some, if not all, of these factors may be interrelated. Sad to say, there is only a small group of educators in America who relate some of the achievement gap to where our children learn. There is even a more select group that conducts research relating the gap to the condition of the schools. The schools in most need of repair are often those who report lower overall achievement scores. These schools are found in the poor areas of our cities, towns, and rural districts and are disproportionately attended by severe low-income and minority students.

The question is: Are these facilities contributing to the achievement gap? The Education Facilities Clearinghouse recently commissioned C. Kenneth Tanner, Professor Emeritus, University of Georgia, to conduct a meta-analysis of effects of school design on student success. He was able to identify best practices in schools and school design:

  • Safety and security measures, as defined by Tanner’s meta-analysis, have a statistically significant impact on student outcomes.

Students need to feel free from gangs, hunger, intruders, violence, social disparities, and persecution. As Maslow’s hierarchy indicates, humans need to feel secure and have a sense of belonging, safety, and confidence. Have you noted inner city schools in which the very physical setting alarmed your sense of safety and security?

  • Quiet places and spaces for reflection have a statistically significant influence on student outcomes.

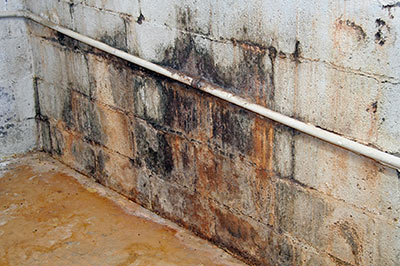
Students need places that make them feel they are needed and belong in the school environment. Again, Maslow wrote about self-actualization and its dependence on both belonging and a place for reflection. All children need small personal learning spaces, alcoves to read, and small group spaces for interaction in safe, dry, and clean facilities. In poorly funded districts, overcrowding and inadequate facility maintenance are more often the reality.

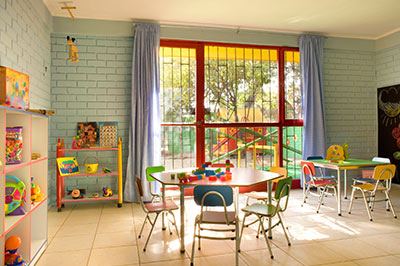
  • Color is statistically significant in its effect on student achievement.

Tanner (2015) wrote: “Color patterns throughout the facility can influence motivation. Hot colors encourage students to become more physically active, while cool colors tend to convey a reassuring effect.” If you have not seen them personally, think about the school facility pictures you have seen where the paint is so old, dull, and peeled you cannot even tell what color it is. Sad to say, students affected by the achievement gap often are relegated to these rundown schools.

  • Ample state-of-the-art technology for teachers and students makes a statistically significant contribution to student achievement.

It is impossible for the educator to know how teaching and learning will be influenced by technology in the future; however, are students in our less wealthy districts being afforded the same technological opportunities as students in the more wealthy districts? How can we expect the same outcomes without the same opportunities; i.e., computers to take home (iPads, Chromebooks, or other handheld devices), computer labs, and teachers knowledgeable about technology and how to use it as a learning and teaching tool?

These are only four of Tanner’s statistically significant findings. In total he identified twelve findings and fifteen best practices. All fifteen classifications in his research are postulated to have positive effects on student outcomes. I encourage you to read his research and ask yourself the question: Are your schools providing equal facilities to all children? Or, are there inequities that may contribute to the achievement gap?

As noted a few paragraphs ago, Marshall spoke of poor school facilities over four decades ago. He did not call it the achievement gap, but he spoke of opportunities lost and talents wasted. We can debate how to solve the problem, and discussion is needed. The school facility, however, is a “fixable” component of improving student achievement. Why are so many schools districts across the nation not enabled to improve the places where our students learn—especially for the minority and low-income students most affected by the achievement gap?

References and Resources:

Ballenger, K. A. (2014). The grave disparities in modern education, segregation, and school budgeting: A comparison between Brown v. Board of Education and San Antonio Independent School System District v. Rodriguez. Knoxville, TN: Trace: Tennessee Research and Creative Exchange.

Lacoe, J. (2013, March). Too scared to learn? The academic consequences of feeling unsafe at school. New York: Institute for Education and Social Policy (IESP). Retrieved on August 7, 2015 from http://steinhardt.nyu.edu/scmsAdmin/media/users/ggg5/Working_Paper_02-13.pdf

Martorell, P., McFarlin, Jr., I., & Stange, K. (2014, December). Investing in schools: Capital spending, facility conditions, and student achievement. Retrieved from Federal Reserve Bank of New York on August 7, 2015: http://m.newyorkfed.org/research/education_seminar_series/Stange.pdf

Service Employees International Union. (n.d.). Falling further apart: Decaying schools in New York City’s Poorest Neighborhoods. Retrieved on August 7, 2015: http://www.seiu32bj.org/wp-content/uploads/2013/05/falling-further-apart1.pdf

Smith, C. D. (2014). Continued disparities in school facilities: Analyzing Brown v. Board of Education’s singular approach to quality education. Tennessee Journal of Race, Gender, & Social Justice, 3(1), p. 38-66.

Tanner, C. K. (2015). Effects of school architectural designs on students’ Accomplishments: An meta-analysis. Retrieved from the Education Facilities Clearinghouse (EFC) on August 17, 2015: http://www.efc.gwu.edu//library/effects-of-school-architectural-designs-on-students-accomplishments-a-meta-analysis/

Vincent, J. M., & Filardo, M. W. (2008, June). Linking school construction investments to equity, smart growth, and healthy communities. Retrieved from Center for Cities & Schools (CC&S) and Building Educational Success Together (BEST) on August 7, 2015: http://citiesandschools.berkeley.edu/reports/Vincent_Filardo_2008_Linking_School_Construction_Jun2008.pdf

Linda Lemasters, Director, Education Facilities Clearinghouse

Linda is an associate professor in the Graduate School of Education and Human Development of the George Washington University, where she advises students, directs student research, and directs a project at Taibah University in the Kingdom of Saudi Arabia. Her areas of expertise and research include educational planning, facilities management, and women CEOs. She actively conducts research concerning the effects of the facility on the student and teacher, publishes within her field, and has written or edited numerous books including School Maintenance & Renovation: Administrator Policies, Practices, and Economics and book chapters including a recent chapter, Places Where Children Play, published July, 2014 in Marketing the Green School: Form, Function, and the Future.

Center for Cities + Schools, 2014

Introduction: Seeking Options for California

California lawmakers are debating the future of the state’s role in providing school construction and modernization funds to local school districts – a school facility funding role the state has played since 1947. Previous statewide school construction bond authority is exhausted. The legislature is moving forward with Assembly Bill 2235 (The Kindergarten-University Public Education Facilities Bond Act of 2014), with an as-yetunspecified bond amount. The bill proposes only minor tinkering to the state’s current school facility funding program. However, Gov. Brown has signaled he wants fundamental changes to the competitive, “first-in, first-out” funding approach of California’s K-12 School Facility Program.

View Survey

Vincent and Gross, 2015

K-12 public school facilities need regular investment to ensure student health and safety and support educational programming. Yet, the future of K-12 school facility funding in California is uncertain. A strong state-local partnership has existed that funded new construction, modernization, and other investments in public school facilities across the state since the passage of The Leroy F. Green School Facilities Act (SB 50) in 1998, which established the School Facility Program (SFP). Since then, four statewide school construction bonds have generated $35.4 billion and local school districts have leveraged these state funds, passing more than $80 billion in local general obligation bonds.2 Together with locally-generated developer fees, these sources formed the “three-legged stool” of financing for K-12 public school facilities under the SFP. Currently, there are no funds identified for the state’s “leg” in the partnership. The debate about the future of the state’s school facility funding will be taken up in the 2015-2016 legislative session.

View Working Paper

Duncombe and Wang, 2009

Traditionally, financing the construction of school facilities has been a local responsibility. In the past several decades, states have increased their support for school facilities. Using data collected from various sources, this study first classifies the design of capital aid programs in all 50 states into various categories based on the scope of state aid, selection of capital projects, method of grant distribution, and formula components of the grant. The condition of school facilities has increasingly become a concern of school finance litigation in recent years. The equitable distribution of capital-outlay funds is likely to receive additional notice in the future. Using NCES finance data from 1998 to 2002, we examine the relationship between the type of facilities aid program and the level of inequality in capital-outlay distribution in the states.

View Article